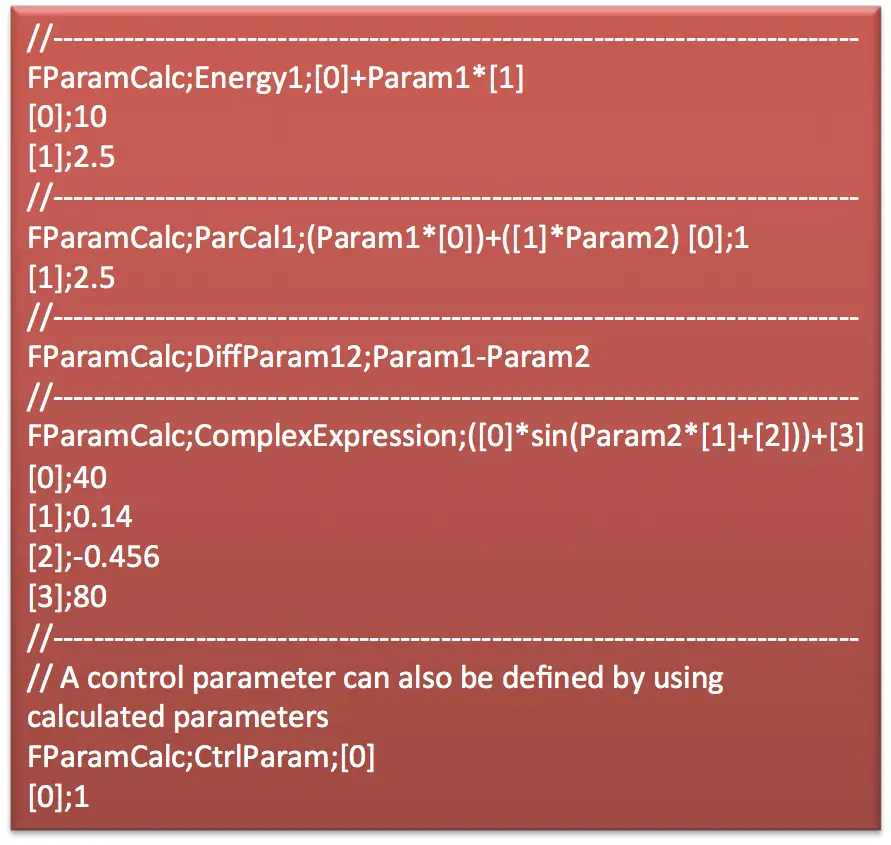
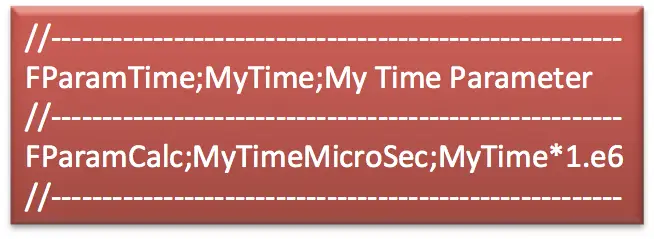
Calculated parameter (FParamCalc)
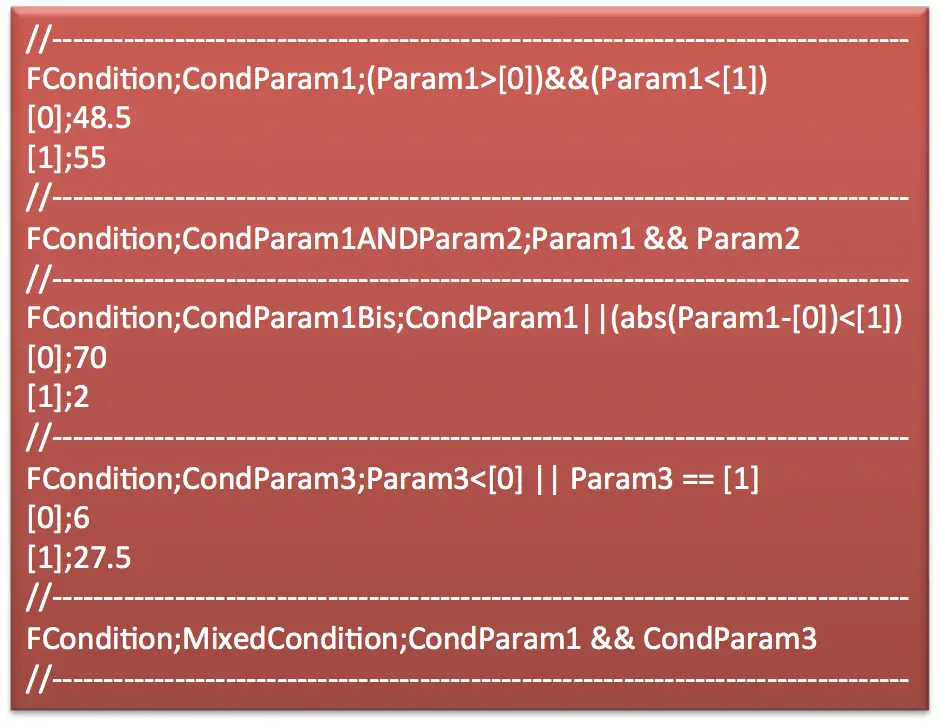
Condition parameter (FCondition)
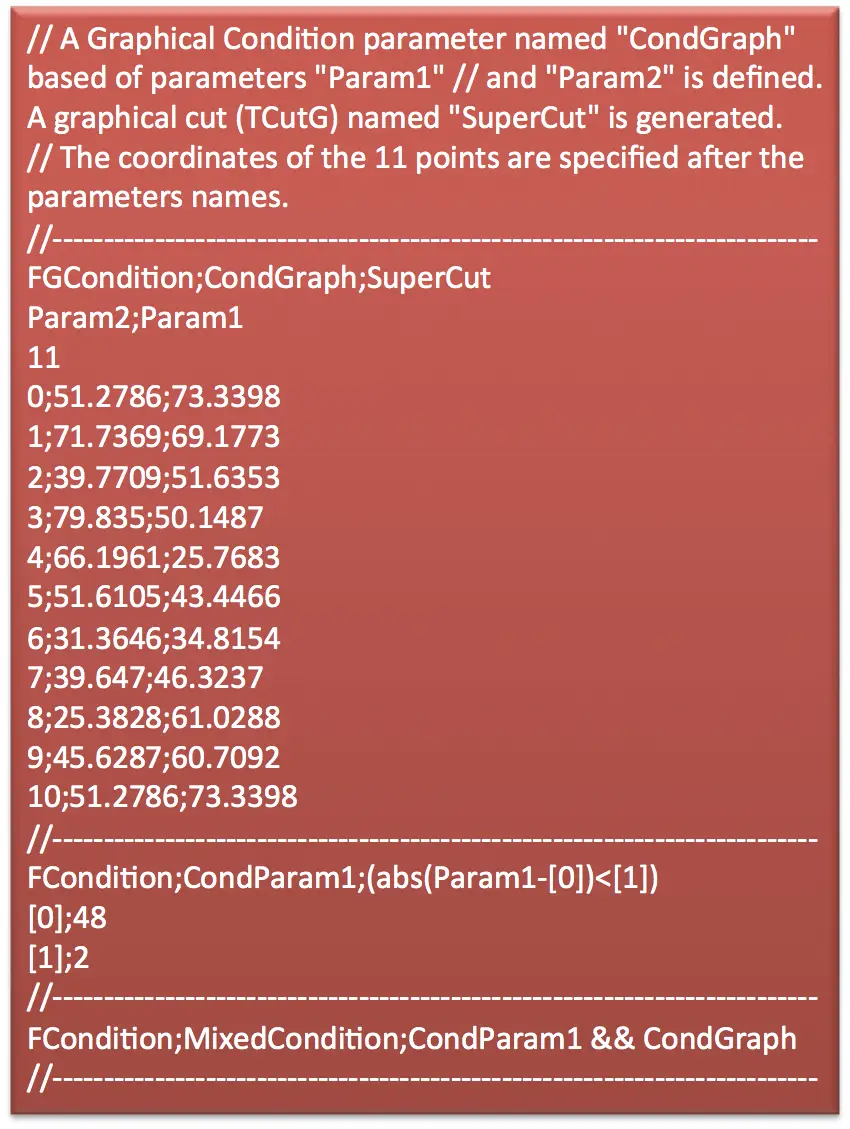
Graphical cut parameter (FGCondition)
Time parameter (FParam Time)
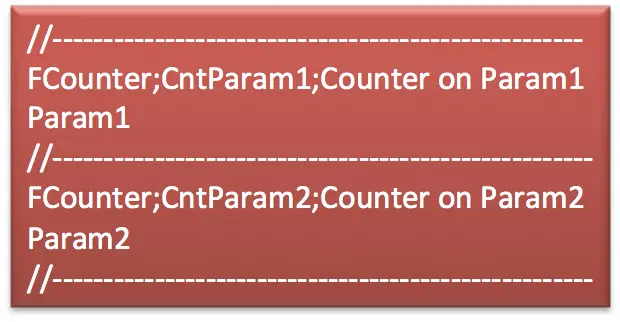
Counter parameter (FCounter)
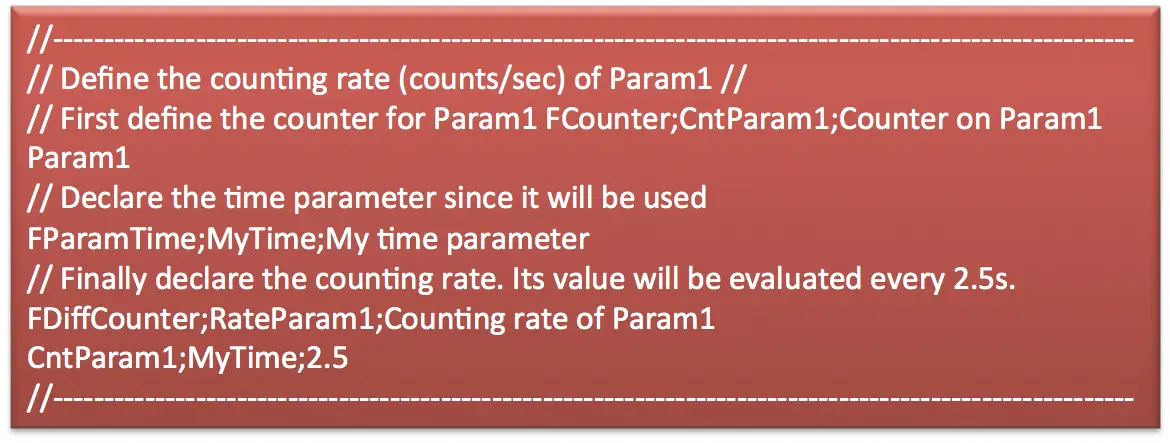
Differential counter parameter (FDiffCounter)
Persistent parameter (FParamLastValue)

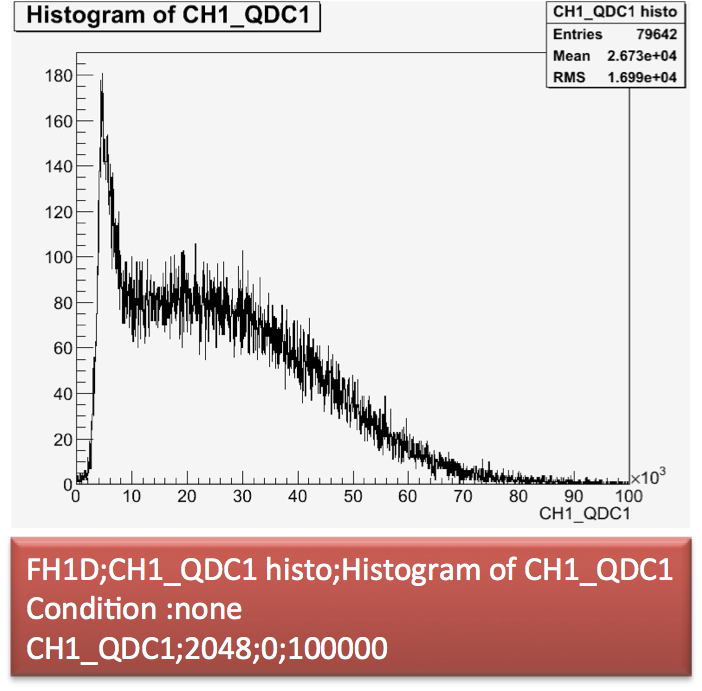
1D Histogram (FH1D)
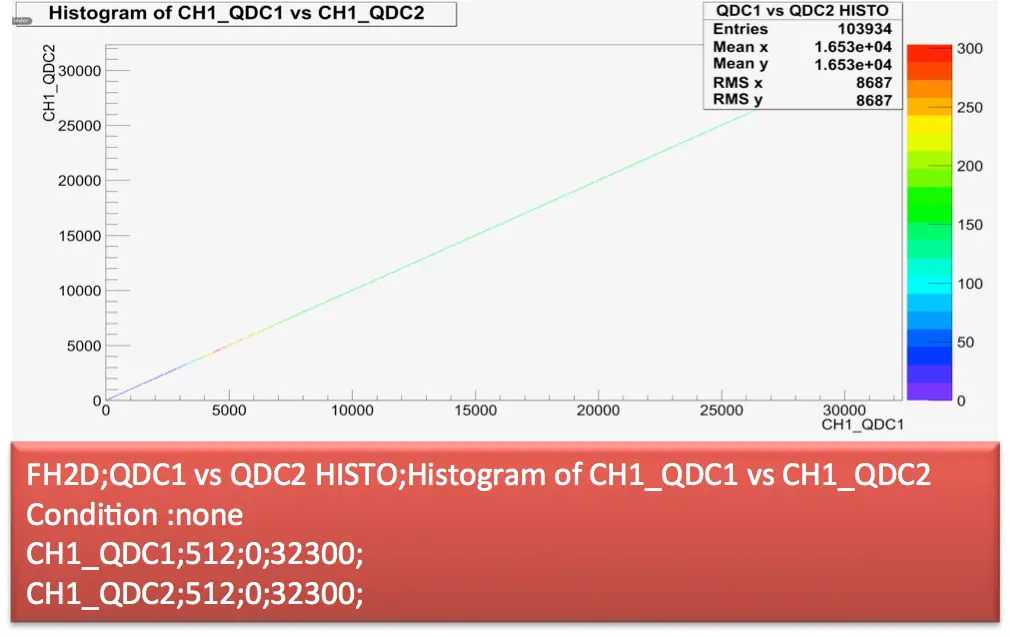
2D Histogram (FH2D)
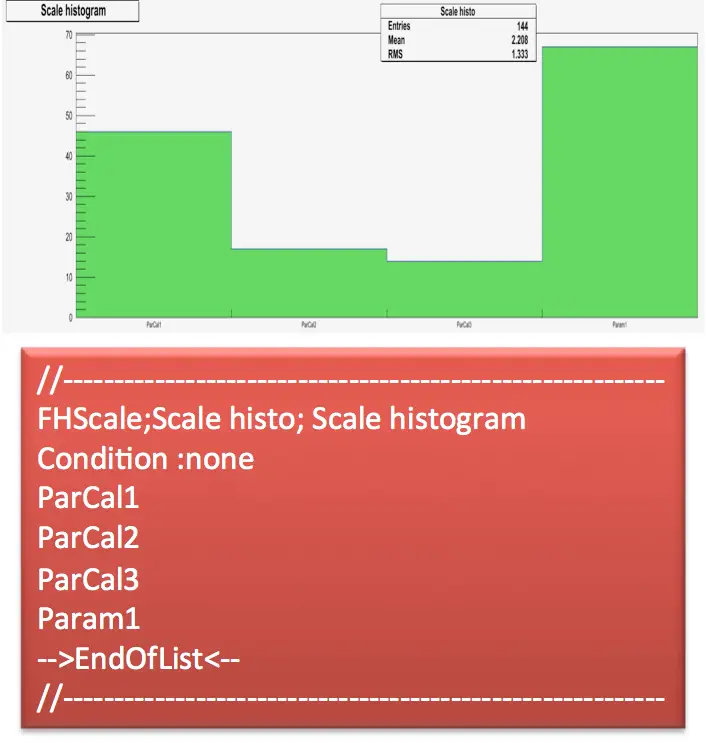
Scale histogram (FHScale)
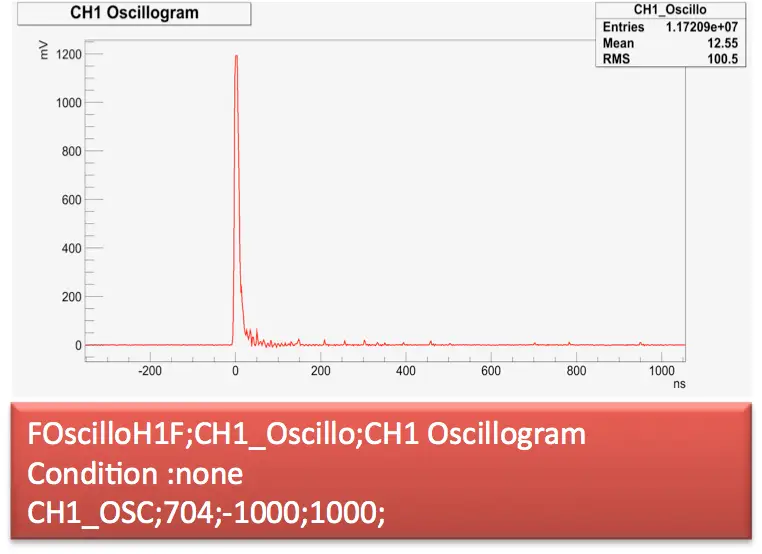
Oscillogram (FOscilloH1F)
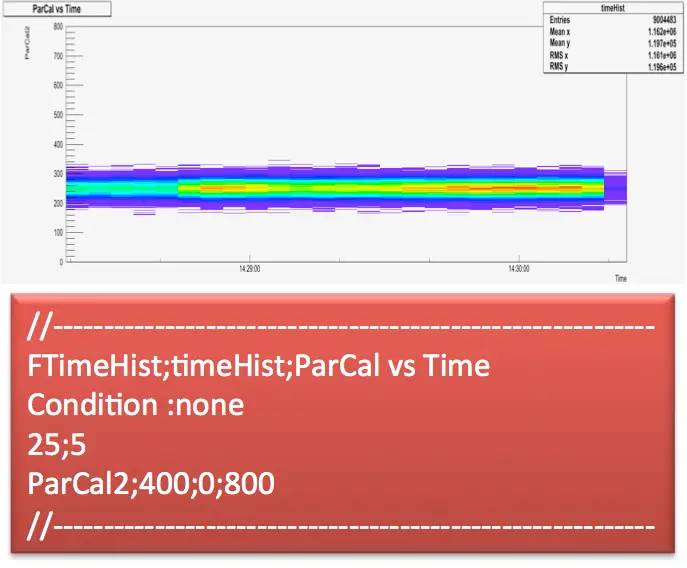
Time histogram 2D (FTimeHist)
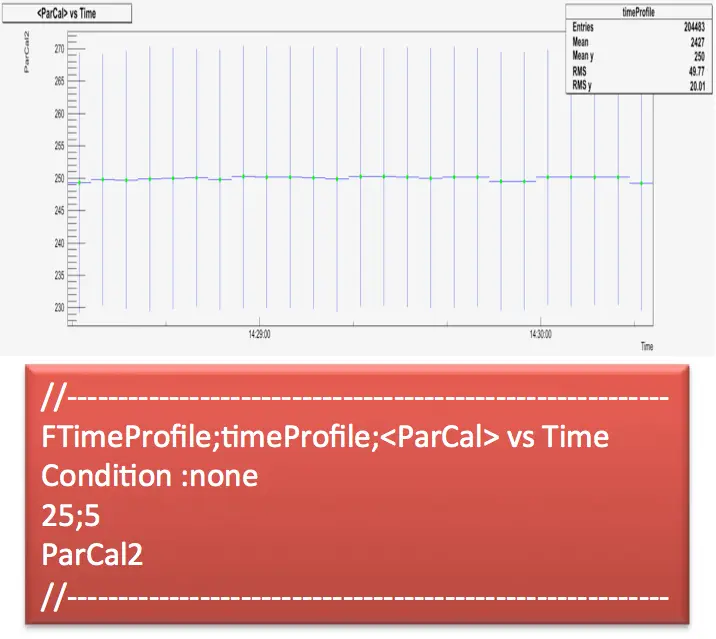
Time profile histogram (FTimeProfile)
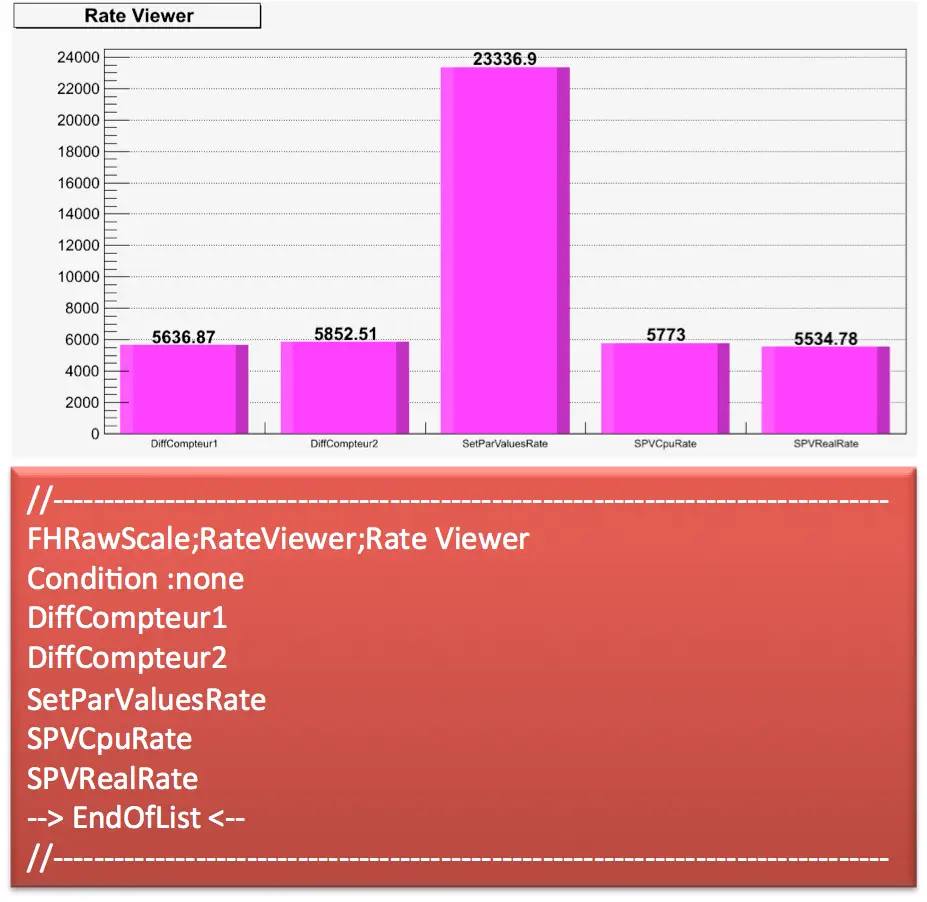
Scale count histogram (FHRawScale)